
Discover heuristic evaluation
How you can cost-effectively evaluate the user-friendliness of your website and digital applications.
With the right UX KPIs, you can continuously improve the user experience and ensure the long-term success of your digital product or service.

UX KPIs (User Experience Key Performance Indicators) are metrics that show how efficiently and successfully users reach their goals on your website or digital product. They help you analyze where problems occur in the user flow and identify opportunities for optimization. In other words, they measure how satisfactory your users' interaction with your digital product is.
A good user experience is not just a nice-to-have – it's a real business factor. When users achieve their goals faster and enjoy a smooth experience, they are more likely to return and recommend your brand. On the flip side, if the user experience is lacking – like when navigation is clunky or finding information feels like a challenge – users are often just one click away from turning to your competitors.
A strong user experience therefore directly contributes to increased revenue. Since UX design drives business growth, the motto holds true: "Good UX is good business."
With this in mind, removing potential barriers should be a priority. While improvements can be made without defined KPIs, user experience metrics uncover patterns that are otherwise difficult to detect. They provide the foundation for data-driven decisions rather than relying on gut feelings.
Sound familiar? You’re in a meeting, and someone says, “I think customers will feel…” or “I believe users expect…” But is that enough to ensure your digital product performs at its best? UX often feels subjective – after all, it’s about the impression users get while interacting with a website or digital product. But can you really measure the user experience? Can it be backed up with solid data? The answer is a resounding yes!
With the help of clearly defined UX KPIs, you can objectively capture user behavior and collect data to evaluate how well your digital product is performing. Such usability metrics help you to identify exactly where users encounter problems. Measuring user experience means:
UX metrics provide the foundation for keeping your digital product competitive and driving long-term business success.
Depending on your project needs, several UX metrics might be relevant – here are six of the most common examples to consider:
| Type | UX KPI | Explanation | Example |
|---|---|---|---|
|
Usability KPIs |
Task Success Rate |
Percentage of users successfully completing a task |
Subscribe to a newsletter; Find repair times for an appliance in the database |
|
User satisfaction metrics |
Content Satisfaction Score |
Measures satisfaction with text content and gathers feedback |
Post-read query: "Did you find this article helpful?" |
|
User engagement metrics |
Monthly Active Users (MAU) |
Number of active users per month |
B2B service portals (e.g. Angelini’s Apotheken Plus Portal, STIHL’s SSC database) |
|
Accessibility metrics |
WCAG conformity |
Assesses compliance with Web Content Accessibility Guidelines (WCAG) |
AAA rating, see accessible web design |
|
Accessibility metrics |
WCAG conformity |
Assesses compliance with Web Content Accessibility Guidelines (WCAG) |
AAA rating, see accessible web design |
|
Diagnostic metrics |
Rage-clicks |
Tracks repeated clicks, indicating user frustration; data on clicks and mouse movements recognizable in heatmap tools |
High click activity on images where zoom or links are expected |
|
Performance metrics |
Largest Contentful Paint (LCP) |
Part of Google's Core Web Vitals – tracks when the largest visible content fully loads |
The perceived loading speed of a website, multiple large images, and load times over 3 seconds. |
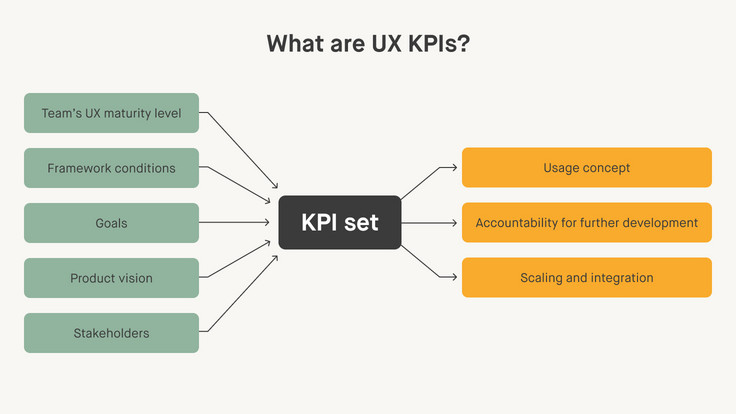
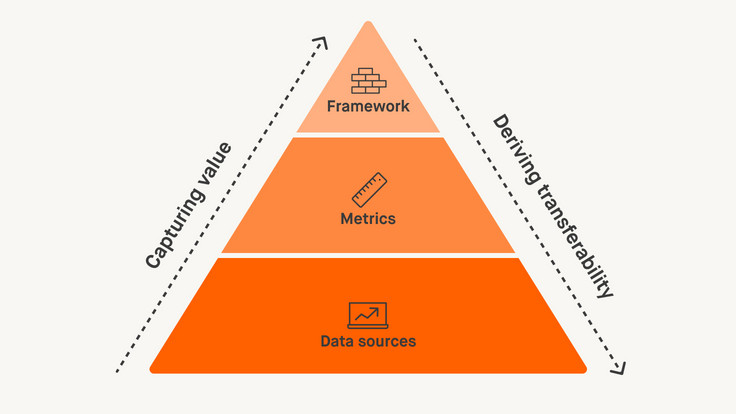
KPIs are not universal rules but guidelines that are defined collaboratively with the project team. User experience metrics can be categorized into three levels:
It is important to be able to understand and describe the data points in order to track their business relevance and leverage them effectively. Questions to ask when defining UX KPIs:
Vanity metrics are data points which often look impressive in reports but contribute little to UX optimization. Examples include the Net Promoter Score (NPS) and Customer Satisfaction Score (CSAT). At Moccu, we avoid such metrics because they fall under attitude-related metrics, which depend on the user's intentions and the context.
Behavioral metrics, which reflect specific user actions, are more valuable for UX as they reveal how users truly interact with a website or service – independent of their attitudes or intentions.
While vanity metrics are common and often automatically provided by platforms, they typically lack the depth and context needed for meaningful UX improvements. They’re also frequently overused or introduced too early in the customer journey.
Often used to highlight quick wins under time pressure, vanity metrics rarely support long-term optimization. Instead, it’s more effective to focus on usability metrics that reveal real user behavior and actionable opportunities for improvement.
To create an optimal user experience, UX designers should start by identifying which KPIs are most relevant to their specific project. Selecting meaningful KPIs and tracking them over time is essential for reliable insights. Using statistical methods for data collection ensures accurate and credible results.
KPIs should be measured consistently and evaluated in the context of competitors and diverse user segments. While the number is very individual, the general rule is: fewer, well-defined KPIs are more effective.
With the right KPIs in place, you can implement targeted strategies to continuously enhance the user experience. Below, we share proven tips and methods to optimize UX effectively and achieve measurable results.
Contact us for a customized consultation – we will help you analyze all relevant metrics.
We recommend using triangulation, which involves combining qualitative and quantitative data with expert analysis to make well-informed decisions. Practically, this means leveraging qualitative evaluations of user feedback to ask why users behave a certain way, rather than relying solely on quantifiable UX success metrics.
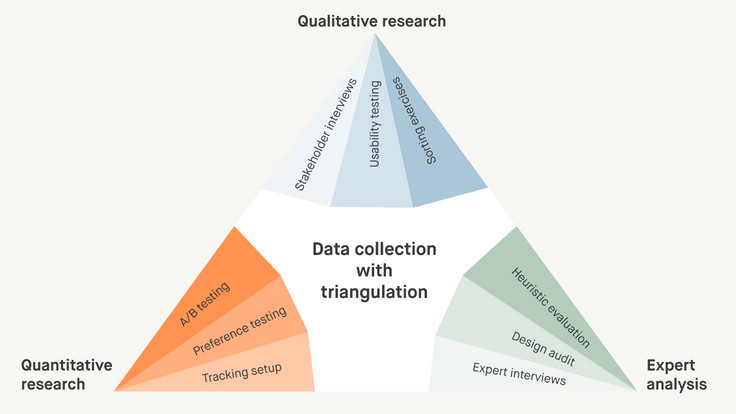
To achieve this, we gather data from various user research methods – such as usability testing, customer surveys, and A/B testing. Basic statistical knowledge is valuable here, as it helps minimize the risk of misinterpreting random sampling effects or outliers. By combining qualitative and quantitative insights, as well as multiple metrics, you gain a more comprehensive understanding of the user experience.
We’re here to help you kickstart tracking your UX and business KPIs for lasting success!
The same principles apply to UX metrics as to any other metrics: using consistent measurement values should produce comparable results each time. However, because human behavior is inherently diverse, achieving consistency with UX metrics can sometimes be a challenge.
KPIs and UX metrics help to provide neutral information and make design decisions that are not limited by personal bias. By collecting and analyzing metrics from the outset, we can ensure your UX strategy is grounded in measurable evidence, driving meaningful improvements and advancing your website's performance.
Design research is central to understanding whether users are successfully completing their goals and tasks with your digital product. It provides valuable, quantifiable data gathered through targeted research and performance analysis.
Research methods include moderated and unmoderated testing, interviews, surveys, card sorting, first-click testing, and heuristic evaluations. These approaches are effective even when working with small sample sizes.
Collected data should be shared across teams using tools such as dashboards, UX scorecards, or quarterly reports. Such visualizations make it easier to get the whole team on the same page and have a productive exchange about targeted optimization measures. This approach helps you develop a product that is precisely tailored to your target audience's needs while enhancing brand affinity – a significant competitive advantage.
To evaluate the effectiveness of design improvements, old and new versions should be compared. This process can yield three possible outcomes:
A) The new version outperforms the old version
B) The new version performs worse than the old version
C) There is no significant difference between the versions
Regardless of the result, these comparisons offer valuable insights into which strategies are effective, which require adjustments, and which may not be worth pursuing. A/B testing is a reliable method for implementing and validating targeted optimizations.
We’re happy to advise you on various testing methods or conduct them on your behalf.
The constant optimization of the user experience makes a significant contribution to remaining competitive. The aim should be to establish continuous UX measurement with a suitable sample size for each survey. UX KPIs serve as a robust foundation for making objective, data-driven design decisions and driving consistent improvement.
A thoughtful combination of qualitative and quantitative data provides a deeper understanding of user needs and highlights pain points in their journey. By conducting regular usability tests and monitoring usability performance over time, you can ensure your product consistently meets user expectations and achieves sustained success.
Yes, the user experience can be measured using UX metrics, i.e. a series of quantitative data points.
For example, we can find out whether users have successfully completed a task, such as an order or booking, and how long it took them to complete it.
Typical UX KPIs are usability metrics, User retention and satisfaction metrics as well as accessibility, diagnostic and performance metrics, for example:
A UX analysis is an analysis of the user experience based on usability metrics. This includes conducting research, obtaining user feedback and recording relevant UX KPIs.

Thank you for your message! We will get in touch with you as quickly as possible!